September 2025 | Japan Used Car Export Trends
- 2025年11月8日
- 読了時間: 13分
— UAE and Russia Lead as Anchor Markets; Chile Doubles Its Presence
Executive Summary
Japan’s used-car exports showed a solid rebound in September 2025, climbing +11.8% month-on-month across 30 key destinations. Out of these, 22 markets expanded while only eight contracted — indicating broad-based growth momentum across major trade lanes.
Anchor Markets
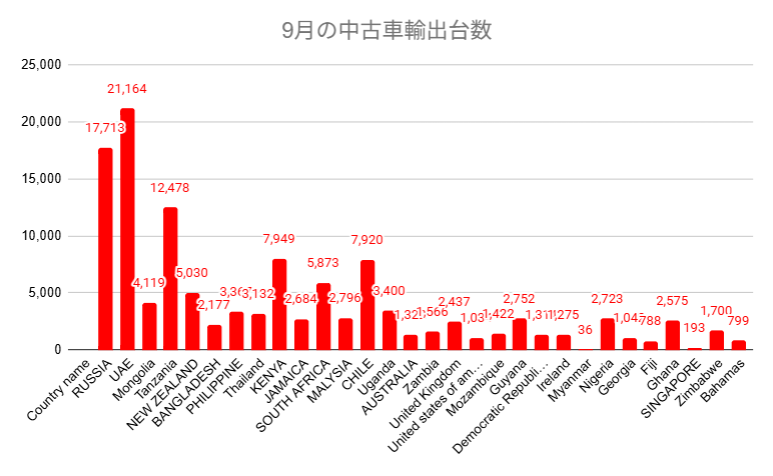
United Arab Emirates (UAE): 21,164 units (+12.1%), accounting for 17.2% of total exports
Russia: 17,713 units (+16.7%), representing 14.4% of the total
Together, these two anchor markets contributed over 31.6% of Japan’s total used-car exports, providing the central axis of demand.The third-largest destination, Tanzania (12,478 units / +4.6%), continued to act as the East African hub for right-hand-drive vehicles.
Top 5 Growth Markets
Chile +103.3% (3,896 → 7,920 units / +4,024 units)
Malaysia +29.3% (+634 units)
Mongolia +27.2% (+880 units)
Ireland +27.1% (+272 units)
Uganda +26.5% (+713 units)
South America and Southeast Asia emerged as the strongest regions in September, driven by regulatory transitions and logistics normalization following mid-year shipping congestion.
Bottom 5 Declining Markets
Australia –36.7% (2,089 → 1,322 units / –767 units)
United States –32.0% (1,521 → 1,034 units / –487 units)
Myanmar –28.0% (–14 units)
New Zealand –19.4% (6,237 → 5,030 units / –1,207 units)
Jamaica –19.2% (3,321 → 2,684 units / –637 units)
Australia’s sharp contraction reflects tighter import approvals and weaker retail turnover, while the U.S. slowdown stems from high interest rates, shipping costs, and fading demand for large-engine SUVs.
Key Takeaways
Broad Recovery: The rebound in 22 markets confirms structural resilience in global demand.
Regional Realignment: Asia and South America show renewed momentum; Oceania and North America enter adjustment phases.
Strategic Focus: Companies should prioritize inventory turnover, working-capital velocity, and shipping slot optimization rather than pure volume expansion.
Summary for Executives:The September data highlights a decisive split between momentum markets and cooling ones. UAE and Russia continue to anchor Japan’s export ecosystem, while Chile’s doubling output signals renewed appetite in South America. Looking ahead to Q4 2025, speed of allocation — in inventory, shipping, and cash — will define competitiveness in the global used-car supply chain.

Overall Snapshot — The Center of Gravity in September
The top five destinations accounted for more than half of Japan’s total used-car exports in September.UAE (17.2%), Russia (14.4%), Tanzania (10.2%), Kenya (6.5%), and Chile (6.5%) together represented 54.8% of all shipments — a clear concentration of demand within just a handful of anchor markets.
From the perspective of volume contribution (unit-based increase), the major positive drivers were:Chile (+4,024 units) > Russia (+2,529) > UAE (+2,281) > South Africa (+1,067) > Mongolia (+880).Conversely, the leading negative contributors were:New Zealand (–1,207) > Australia (–767) > Jamaica (–637) > United States (–487).
Key Insight:The majority of September’s overall growth can be explained by how efficiently exporters managed inventory rotation, shipping capacity, and working capital in the high-impact markets of Chile, Russia, and the UAE.Meanwhile, the contractions in New Zealand and Australia highlight the need to reassess Pacific shipping routes and rebalance product mix strategies to stabilize returns in slower-moving destinations.
Why Chile’s Used-Car Imports Surged in September 2025
🏆 #1 Growth Market: Chile (+103.3%)
Executive Summary
Chile’s used-car imports doubled in September 2025, largely due to a surge in re-export flows via Free Trade Zones (FTZs) such as Iquique and Arica.Under Chile’s Automotive Statute (Law 18.483, Article 21), used-car imports into the domestic market are prohibited, but FTZ transactions and re-exports are permitted exceptions.Official sources (Aduana Chile, BCN Chile) confirm that vehicles may be imported into FTZs for storage and resale, but cannot be released for domestic circulation, where only new vehicles are authorized.
Three technical drivers explain September’s jump:
FTZ inventory buildup for re-export routes to Bolivia and neighboring markets.
Pre-emptive shipments ahead of stricter Euro 6c emissions compliance taking effect around October 1.
Shipping “bunching” caused by Ro-Ro and container scheduling overlaps at Iquique Port.
Regulatory Framework — Key Practical Points
General Rule:Used-car imports for domestic circulation are prohibited (Law 18.483 Art. 21).Exceptions apply only to FTZs, returning residents, disabled persons, and diplomatic cases.
FTZ Role:In Iquique (ZOFRI) and Arica, used vehicles can be stored and traded under bonded status, but not sold within mainland Chile.These cars are typically re-exported to third countries, especially Bolivia and Paraguay.
Customs and Taxation:The standard domestic tariff of 6% import duty + 19% VAT applies only to new vehicles.Used cars in FTZs remain duty-suspended until re-export, making bonded logistics and cost efficiency the central business factor.
Returning-Resident Provision:Individuals returning to Chile may import one personal used vehicle, but the program is small-scale and irrelevant to commercial volume.
Interpreting the 103% Increase
Re-Export Pipeline Expansion:Bolivian data show recurring “ZOFRI → Bolivia” flows, confirming a structured re-export corridor.September likely reflects inventory accumulation in FTZs ahead of October cross-border releases.
Pre-Regulation Demand Spike:As Euro 6c enforcement tightened around September 30, importers advanced model updates and certification paperwork, creating a one-time surge.
Shipping Bunching:Ro-Ro and container services to Iquique often converge within the same week, producing temporary “month-end spikes.”This reinforces that the September boom combines both policy timing and logistical clustering.
Operational Insights
Product Strategy:Select SKUs that match year, steering position, and emissions standards required in destination markets (Bolivia, Paraguay, etc.).Chile’s domestic market is left-hand drive, but only FTZ → third-country trade is legally viable.
Logistics:Use Iquique or Arica yards as re-export hubs. Secure Bolivian border clearance slots in advance and align port arrival → bonded storage → border exit into a single timeline.
Documentation:Any mismatch in VIN, model year, or emissions certification leads directly to FTZ storage delays.Standardize all paperwork and Incoterms for re-export use only.
Risk Management
Regulatory Volatility:During emission-standard transitions (Euro 6c and beyond), expect short-term port or FTZ congestion.Continuously track model-year thresholds via customs circulars.
Destination-Market Risk:Bolivia and Paraguay frequently modify age limits and tax rules for used imports.Keep monthly updates from local customs agents integrated into planning.
Cash-Flow Control:Because FTZ inventory monetizes only after cross-border release, maintain strict KPIs on inventory days and receivables.Structure sales contracts that explicitly include re-export acceptance conditions.
Note on Legal Accuracy
Online sources sometimes misstate Chile’s policy as a “five-year age limit.”Official references clearly state:Law 18.483 Art. 21 = Domestic used-car imports are banned; FTZ operations are exceptions.Accordingly, practical business design must be based on bonded FTZ handling → third-country re-export as the lawful framework.
Why Malaysia’s Used-Car Imports Rose Sharply in September 2025
🏆 #2 Growth Market: Malaysia (+29.3%)
Executive Summary
Malaysia’s imports grew +29.3% month-on-month, driven by steady demand, normalization of the Approved Permit (AP) issuance process, and front-loaded EV shipments ahead of the 2025 duty-exemption deadline.All commercial vehicle imports require an AP issued by MITI (Ministry of Investment, Trade and Industry), while taxation is governed by Royal Malaysian Customs (JKDM) under the Sales Tax (SST) and Excise Duty schemes.Reconditioned (“recon”) vehicles flow primarily under Open AP or Franchise AP categories.
Policy and Compliance Basics
AP Requirement:All passenger-vehicle imports for resale need a valid AP.MITI issues APs through its ePermit system, categorized by Open AP or Franchise AP.The system preserves industrial order, safety, and environmental compliance, and governs reconditioned imports as well.
Customs Procedure:Completely built-up (CBU) vehicles are taxed via Form K1 declaration.Excise Duty (≈ 60–105%) and SST (10%) vary by displacement, origin, and trade agreement status.
Classic-Car Exception:Since 2018, “Classic APs” apply only to vehicles over 35 years old — a niche, non-commercial segment.
EV Incentive Window:Import, excise, and road-tax exemptions for fully imported EVs remain effective until end-2025, with no confirmed extension.This “deadline effect” has encouraged early shipment of eligible models.
Decoding the +29.3% Rise
Shipping Normalization:August’s limited slots cleared, and several delayed Ro-Ro/containers landed in September, bringing previously approved AP batches through customs simultaneously.
EV Deadline Effect:Importers accelerated EV orders ahead of the 2025 tax-holiday expiry, widening total monthly volume.
Mid-Tier Shift:Tax pressure on large-engine vehicles pushed the market toward 1.5–2.0 L hybrids and fuel-efficient models, which deliver faster turnover and better tax efficiency.
Operational and Commercial Insights
Product Focus:Favor hybrids and small-displacement “clean” vehicles with solid fuel economy and residual value.Transparent maintenance records and grading reports accelerate retail sales.
EV Handling:Compress the logistics cycle — shipment → customs → registration → cash collection — before the duty-free window closes.Include a tax-change clause in contracts to hedge policy risk.
Compliance Workflow:Double-verify model, VIN, and certificate-of-origin data before ePermit submission.Track K1 declarations weekly to prevent customs rejections.
Tax Simulation:Build a cost matrix by engine size × origin × model, pre-estimating excise + SST liabilities to optimize both margin and turnover speed.
Risk Highlights
EV Incentive Expiry:Delayed registrations may forfeit exemptions; ensure every EV unit clears before Dec 2025.
Documentation Errors:Incorrect AP category or mismatched VIN/year causes costly customs delays.
Financial Exposure:Manage MYR volatility and rising finance costs by revising pricing cadence monthly.
Bottom Line
“Move good cars quickly.”By focusing on mid-range, high-turnover hybrids and small engines aligned with AP and tax frameworks, importers can convert September’s momentum directly into cash flow.EVs, meanwhile, must be treated as time-sensitive inventory under a visible deadline.
Why Australia’s Used-Car Imports Fell Sharply
❌ #1 Decline Market: Australia (–36.7%)
Executive Summary
September saw a steep –36.7% drop, signaling a clear cooling in demand and procedural flow.Primary causes: tighter import approval, higher logistics costs, and slower turnover of high-value SUVs.The immediate task for exporters is to re-align stock toward mid-price segments and diversify shipping routes.
Regulatory Context
Under the Road Vehicle Standards Act 2018, all vehicles — new or used — require Import Approval prior to customs clearance.Non-approved imports are detained at the border.
Vehicles must comply with the Australian Design Rules (ADRs) before registration.
The process includes import application, customs, quarantine (biosecurity), and registration prep, often taking several weeks to months.
Underlying Drivers
Approval Delays:Approvals and ADR compliance reviews have become slower and stricter, adding cost and uncertainty.
Shipping & Cost Pressure:Rising Pacific freight rates and limited Ro-Ro slots extended transit times, creating shipment gaps.
Inventory Mismatch:Premium and large-engine vehicles have slowed in retail turnover, tying up capital and reducing profitability.
Practical Checklist
Re-evaluate product mix toward mid-price, fuel-efficient vehicles.
Initiate import approvals early, aligning purchase orders with lead-time forecasts.
Diversify shipping portfolios across carriers to hedge delays.
Track inventory days and cash-collection cycles, targeting 30-day rotation.
Risk Watch
Cost overruns from delayed approvals or unsold inventory.
Profit erosion from exchange-rate swings and high domestic interest rates.
Over-pursuit of volume leading to capital lock-in.
Bottom Line:“Don’t chase volume—chase rotation.”Australia now demands a lean, cash-efficient operating stance.
Why U.S. Used-Car Imports Declined
❌ #2 Decline Market: United States (–32.0%)
Executive Summary
A –32.0% month-on-month fall underscores persistent headwinds in the U.S. lane.Key drivers: weaker price competitiveness (yen appreciation), rising logistics and insurance costs, and shifting domestic demand—especially for EVs and large SUVs.
Regulatory Landscape
U.S. imports must comply with Customs & Border Protection (CBP), EPA, and NHTSA safety and emissions standards.Laws such as the Motor Vehicle Safety Act and Imported Vehicle Safety Compliance Act govern conformity.
State-level DMVs impose additional rules on emissions, age, and modification, which vary widely.
Total landed cost—including shipping, duty, state tax, and reconditioning—has risen sharply.
Downward Factors
Price Pressure:Despite prior yen weakness, high-value SUVs now face intense price competition and slower retail uptake.
Freight & Insurance Inflation:West Coast port congestion and insurance hikes hit heavier vehicles hardest.
Market Transition:U.S. consumers shift toward EV leasing and subscription models, reducing demand for conventional used imports.
Operational Guidelines
Focus on niche or collector models, especially right-hand-drive or limited editions.
Detail full cost components—shipping, duty, registration, and reconditioning—at quotation stage.
Track state policy changes affecting emissions and age limits.
Risk Notes
Registration delays prolong inventory holding costs.
FX and interest-rate swings squeeze margins.
Mis-timed product repositioning causes stock obsolescence.
Bottom Line:“From volume to value.”For the U.S. market, pivot from mass-market exports to high-margin, specialty segments to maintain profit density.
Conclusion — Navigating September’s Divergence
September 2025 marked both recovery and divergence in Japan’s used-car export landscape.While Chile, Malaysia, and Mongolia capitalized on regulatory shifts and demand resilience, Australia and the U.S. faced high-interest-rate stagnation and procedural friction.
Across all markets, success now hinges on speed and selectivity—the ability to read change early and reallocate inventory, shipping slots, and capital accordingly.Beyond volume, firms must manage cash-flow quality—inventory days, gross-margin rate, and collection cycle—as new KPIs of operational health.
For Q4 2025, the strategic focus will be:
Anchoring around UAE and Russia,
Expanding momentum markets in Africa and South America,
Stabilizing operations in Oceania and North America.
In an environment of constant regulatory and currency volatility, maintaining a structural, data-driven perspective rather than chasing short-term numbers is what will define long-term competitiveness in Japan’s export ecosystem.
国名 | Country name | Aug. | Sep. | Percentage change |
ロシア | RUSSIA | 15,184 | 17,713 | 16.7% |
アラブ首長国連邦 | UAE | 18,883 | 21,164 | 12.1% |
モンゴル | Mongolia | 3,239 | 4,119 | 27.2% |
タンザニア | Tanzania | 11,929 | 12,478 | 4.6% |
ニュージーランド | NEW ZEALAND | 6,237 | 5,030 | -19.4% |
バングラデシュ | BANGLADESH | 2,041 | 2,177 | 6.7% |
フィリピン | PHILIPPINE | 3,035 | 3,367 | 10.9% |
タイ | Thailand | 2,731 | 3,132 | 14.7% |
ケニア | KENYA | 7,385 | 7,949 | 7.6% |
ジャマイカ | JAMAICA | 3,321 | 2,684 | -19.2% |
南アフリカ共和国 | SOUTH AFRICA | 4,806 | 5,873 | 22.2% |
マレーシア | MALYSIA | 2,162 | 2,796 | 29.3% |
チリ | CHILE | 3,896 | 7,920 | 103.3% |
ウガンダ | Uganda | 2,687 | 3,400 | 26.5% |
オーストラリア | AUSTRALIA | 2,089 | 1,322 | -36.7% |
ザンビア | Zambia | 1,591 | 1,566 | -1.6% |
英国 | United Kingdom | 2,117 | 2,437 | 15.1% |
アメリカ合衆国 | United states of america | 1,521 | 1,034 | -32.0% |
モザンビーク | Mozambique | 1,547 | 1,422 | -8.1% |
ガイアナ | Guyana | 2,674 | 2,752 | 2.9% |
コンゴ民主共和国 | Democratic Republic of the Congo | 1,214 | 1,314 | 8.2% |
アイルランド | Ireland | 1,003 | 1,275 | 27.1% |
ミャンマー | Myanmar | 50 | 36 | -28.0% |
ナイジェリア | Nigeria | 2,243 | 2,723 | 21.4% |
ジョージア | Georgia | 875 | 1,042 | 19.1% |
フィジー | Fiji | 726 | 788 | 8.5% |
ガーナ | Ghana | 2,219 | 2,575 | 16.0% |
シンガポール | SINGAPORE | 225 | 193 | -14.2% |
ジンバブエ | Zimbabwe | 1,489 | 1,700 | 14.2% |
バハマ | Bahamas | 729 | 799 | 9.6% |
For more details, Please inquire for further details.
Thank you for your continued support of Japan Carrier.
The Japan Carrier Team
Japan Used-Car Export — September 2025 QA Dataset (English, 50 items)
Overall Trends
Q1. How did total used-car exports move in September 2025 vs. August?
A1. Up about +11.8% overall; 22 out of 30 tracked markets increased.
Q2. Which markets anchored total demand in September?
A2. UAE and Russia, together accounting for about 31.6% of total exports.
Q3. Which country recorded the largest increase?
A3. Chile, +103.3% (3,896 → 7,920 units).
Q4. Which country posted the largest decline?
A4. Australia, –36.7% (2,089 → 1,322 units).
Q5. What share did the top five destinations represent?
A5. 54.8% (UAE 17.2%, Russia 14.4%, Tanzania 10.2%, Kenya 6.5%, Chile 6.5%).
Chile
Q6. Why did Chile’s imports double in September?
A6. Strong FTZ re-export flows (Iquique/Arica), pre-Euro 6c stocking, and shipping bunching.
Q7. Can used cars be imported for sale in mainland Chile?
A7. No. Law 18.483 (Art. 21) bans domestic used-car imports; FTZ exceptions apply for bonded trade/re-export.
Q8. Where are used cars handled legally in Chile?
A8. In FTZs such as Iquique (ZOFRI) and Arica.
Q9. What regulatory timing affected September volumes?
A9. Euro 6c compliance tightening around Oct 1 prompted front-loaded shipments.
Q10. What should exporters align when selecting SKUs for Chile FTZs?
A10. Model year, steering side, and emissions for the destination country (e.g., Bolivia).
Q11. Typical re-export destinations from Chile’s FTZs?
A11. Bolivia (mainly), and Paraguay.
Q12. What documentation risks cause FTZ delays?
A12. VIN/year/emissions mismatches and incomplete certificates.
Q13. Main operational hurdles in the Chile lane?
A13. FTZ congestion from bunched sailings and changing age/emissions rules in receiving countries.
Q14. Which vehicle types tend to move best via FTZ re-export?
A14. Mid-price hatchbacks and SUVs with broad regional demand.
Malaysia
Q15. What permit is required to import used cars into Malaysia?
A15. Approved Permit (AP) from MITI.
Q16. What explains Malaysia’s +29.3% growth in September?
A16. AP normalization, front-loaded EV shipments ahead of 2025’s tax-holiday end, and shipping slot recovery.
Q17. What are the main AP categories?
A17. Open AP and Franchise AP.
Q18. Until when do CBU EV tax exemptions apply?
A18. Through end-2025 (import, excise, and road-tax exemptions).
Q19. How are excise duties applied?
A19. By engine size/origin/model, typically ~60–105%, plus SST (10%).
Q20. What is the “classic car” exception?
A20. 35+ years old vehicles under the Classic AP (niche volumes).
Q21. Key risk when handling reconditioned (“recon”) cars?
A21. AP category errors and VIN/year mismatches causing customs rejections.
Q22. Which SKUs rotate fastest in Malaysia?
A22. Small-displacement and hybrid vehicles (mid-price, tax-efficient).
Q23. What are high-risk cases in Malaysia’s lane?
A23. EVs that miss the 2025 deadline, and AP misclassification at customs.
Q24. What is the fundamental compliance rule for teams?
A24. Double-verify model/VIN/origin before ePermit; aim for zero K1 rejections.
Australia
Q25. Which approvals are mandatory to import into Australia?
A25. Import Approval under the Road Vehicle Standards Act 2018.
Q26. Why did Australia decline by –36.7%?
A26. Stricter approvals, higher freight costs, and slow turnover of high-value SUVs.
Q27. What are ADRs?
A27. Australian Design Rules—safety/emissions standards required for registration.
Q28. Which vehicle types are slowing in Australia?
A28. Large-engine, high-price SUVs and premium models.
Q29. Practical response for exporters?
A29. Shift to mid-price, fuel-efficient SKUs and diversify carriers.
Q30. Suggested KPI targets?
A30. ≤30 inventory days, ≤60 days cash-collection cycle.
United States
Q31. What’s behind the U.S. –32.0% drop?
A31. Weaker price competitiveness, freight/insurance inflation, and demand shifts (EVs/large SUVs).
Q32. Which U.S. authorities/acts govern imports?
A32. CBP, EPA, NHTSA, and laws like the Motor Vehicle Safety Act.
Q33. Do state-level rules vary?
A33. Yes—emissions, age limits, and modification rules differ by state.
Q34. Where should exporters focus in the U.S. now?
A34. Niche/collector models and RHD limited editions (value over volume).
Q35. What costs must be itemized in quotes?
A35. Shipping, insurance, duty, state taxes/DMV, reconditioning.
Other Major Destinations
Q36. What was Tanzania’s September volume?
A36. 12,478 units (+4.6% m/m).
Q37. Kenya’s September volume?
A37. 7,949 units (+7.6% m/m).
Q38. Why did Mongolia recover?
A38. Seasonal transport peak and border-clearance stabilization.
Q39. What lifted South Africa?
A39. FX stabilization and strong SUV demand (+22.2%).
Q40. Why did New Zealand fall?
A40. Higher rates and shipping delays (–19.4%).
Management & Operations
Q41. Which executive KPIs matter most now?
A41. Inventory days, working-capital velocity, gross margin, shipping lead time.
Q42. What is the monthly strategy theme?
A42. Allocate between “attack” and “defend” markets and reassign people/capital quickly.
Q43. What does turnover efficiency mean in practice?
A43. Preventing stock build-ups and shortening order-to-cash cycles.
Q44. Which regions to watch in Q4 2025?
A44. UAE/Russia as anchors; expand South America and East Africa lanes.
Q45. Which markets require caution?
A45. Australia and the U.S., given high rates and procedural friction.
Data & KPI Facts
Q46. What was the total tracked volume in September?
A46. 122,780 units across the 30 markets.
Q47. Month-on-month growth rate?
A47. About +11.8%.
Q48. Top-five ranking by volume?
A48. 1) UAE, 2) Russia, 3) Tanzania, 4) Kenya, 5) Chile.
Q49. Split of increasing vs. decreasing markets?
A49. 22 increasing / 8 decreasing.
Q50. What overarching policy emerges from this analysis?
A50. Prioritize speed and selectivity—reallocate inventory, shipping slots, and capital by market momentum.
👉 Past Export Reports:
📚 過去の統計記事 / Past Monthly Reports:
2024年8月の統計記事 / August 2024 Report
2024年9月の統計記事 / September 2024 Report
2024年10月の統計記事 / October 2024 Report
2024年11月の統計記事 / November 2024 Report
2024年12月の統計記事 / December 2024 Report
2025年1月の統計記事 / January 2025 Report
2025年2月の統計記事 / February 2025 Report
2025年3月の統計記事 / March 2025 Report
2025年4月の統計記事 / April 2025 Report
2025年5月の統計記事 / May 2025 Report
2025年6月の統計記事 / June 2025 Report
2025年7月の統計記事 / July 2025 Report
2025年8月の統計記事 / Augast 2025 Report